| No. | car model | % Breakage | Mileage( thousand km) | |
| 1 | Toyota Prius | 2,2% | 43 | |
| 2 | Porsche 911 | 2.3% | 33 | |
| 2 | Toyota Auris | 2.3% | 37 | |
| 2 | Mazda 2 | 2.3% | 33 | |
| 5 | SmartFortwo | 2,5% | 29 | |
| 6 | Toyota RAV4 | 2,8% | 49 | |
| 9 | Toyota Corolla Verso | 2,8% | 49 | |
| 11 | Mercedes-Benz | 2,6% | 29 | |
| 6 | VW Golf Plus | 2,6%C-Klasse | 2,9% | 46 |
| 11 | Mazda 3 | 2,9% | 42 | |
| 13 | Audi A3 | 3.3% | 53 | |
| 13 | Honda Jazz | 3.3% | 34 | |
| 15 | Mazda MX-5 | 3,4% | 31 | |
| 15 | Toyota Avensis | 3,4% | 55 | |
| 15 | Toyota Yaris | 3,4% | 36 | |
| 18 | Mazda 6 | 3.5% | 53 | |
| 19 | Porsche Boxster / Cayman | 3,6% | 33 | |
| 20 | Audi TT | 3.7% | 41 | |
| 20 | VW EOS | 3.7% | 41 | |
| 22 | VW Golf | 3.8% | 50 | |
| 22 | Opel Meriva | 3.8% | 36 | |
| 24 | Opel Vectra | 4% | 66 | |
| 24 | Kia CEED | 4% | 40 | |
| 26 | Ford Mondeo | 4.1% | 53 | |
| 26 | Ford Fiesta | 4.1% | 36 | |
| 26 | Porsche Cayenne | 4.1% | 52 | |
| 26 | Mazda 5 | 4.1% | 50 | |
| 26 | Suzuki Swift | 4.1% | 36 | |
| 31 | Audi A4 | 4.2% | 71 | |
| 31 | OpelAstra | 4.2% | 51 | |
| 31 | VW Touran | 4.2% | 64 | |
| 34 | Mercedes B-Klasse | 4.3% | 43 | |
| 34 | Opel Tigra Twintop | 4.3% | 32 | |
| 34 | Nissan Note | 4.3% | 41 | |
| 34 | Skoda Fabia | 4.3% | 34 | |
| 34 | Toyota Aygo | 4.3% | 36 | |
| 39 | BMW 7er | 4.4% | 69 | |
| 39 | The Ford Focus C-Max | 4,4% | 47 | |
| 39 | Opel Corsa | 4.4% | 37 | |
| 39 | Honda Civic | 4.4% | 44 | |
| 39 | Suzuki Grand Vitara | 4.4% | 44 | |
| 44 | Ford Focus | 4.5% | 53 | |
| 44 | Opel Antara | 4.5% | 48 | |
| 44 | Kia Rio | 4,5% | 42 | |
| 47 | Audi A6 | 4.7% | 85 | |
| 47 | BMW 1er | 4.7% | 47 | |
| 47 | BMW 3er | 4.7% | 58 | |
| 47 | Fiat Bravo | 4.7% | 35 | |
| 47 | Mitsubishi Colt | 4.7% | 37 | |
| 52 | Mercedes A-Klasse | 4.8%% | 38 | |
| 53 | BMW Z4 | 4.9% | 37 | |
| 53 | Mercedes SLK | 4.9% | 34 | |
| 53 | Nissan Micra | 4.9% | 34 | |
| 53 | Renault Modus | 4.9% | 35 | |
| 53 | SeatAltea | 4.9% | 47 | |
| 58 | Audi A8 | 5% | 85 | |
| 58 | BMW X3 | 5% | 55 | |
| 58 | Ford Galaxy / S-Max | 5% | 68 | |
| 58 | Daihatsu Sirion | 5% | 35 | |
| 62 | Citroen C1 | 5.1% | 42 | |
| 63 | Opel Zafira | 5.2% | 58 | |
| 63 | Honda CR-V | 5.2% | 48 | |
| 63 | Renault Clio | 5.2% | 38 | |
| 63 | Skoda Octavia | 5.2% | 68 | |
| 67 | VW Passat | 5.3% | 88 | |
| 67 | Peugeot 107 | 5.3% | 36 | |
| 69 | Honda Accord | 5.5% | 50 | |
| 69 | Seat Alhambra | 5.5% | 65 | |
| 69 | Subaru Forester | 5.5% | 48 | |
| 72 | Audi Q7 | 5.6% | 75 | |
| 72 | Mini | 5.6% | 36 | |
| 72 | Citroen C4 | 5.6% | 54 | |
| 72 | Mitsubishi Outlander | 5.6% | 52 | |
| 76 | Ford KA | 5.7% | 34 | |
| 76 | VW New Beetle | 5.7% | 35 | |
| 76 | Hyundai Matrix | 5.7% | 38 | |
| 76 | Seat Leon | 5.7% | 51 | |
| 80 | Renault Scenic | 5.8% | 47 | |
| 81 | VW Caddy Life | 5.9% | 60 | |
| 81 | Skoda Roomster | 5.9% | 46 | |
| 81 | Volvo S40 / V50 | 5.9% | 68 | |
| 84 | Opel Agila | 6% | 33 | |
| 85 | VW Polo | 6.1% | 39 | |
| 85 | Nissan X-Trail | 6.1% | 55 | |
| 87 | Hyundai Getz | 6.3% | 36 | |
| 88 | Chevrolet Aveo | 6.4% | 35 | |
| 89 | Mercedes CLK | 6.5% | 44 | |
| 89 | Renault Twingo | 6.5% | 34 | |
| 91 | Smart Forfour | 6.6% | 44 | |
| 91 | VW Touareg | 6, 6% | 66 | |
| 93 | Mercedes E-Klasse | 6.7% | 77 | |
| 94 | VW Fox | 6.9% | 38 | |
| 94 | Hyundai Tucson | 6.9% | 46 | |
| 96 | VW Sharan | 7% | 73 | |
| 97 | Mercedes M-Klasse | 7.1% | 66 | |
| 97 | Mercedes S-Klasse | 7.1% | 72 | |
| 99 | BMW 5er | 7.4% | 75 | |
| 99 | Alfa Romeo 147 | 7.4% | 48 | |
| 99 | Fiat Panda | 7.4% | 36 | |
| 102 | Kia Picanto | 7.5% | 34 | |
| 103 | Chevrolet Matiz | 7.8% | 34 | |
| 104 | BMW X5 | 7.9% | 66 | |
| 104 | Citroen C3 | 7.9% | 38 | |
| 104 | Renault Megane | 7.9% | 52 | |
| 107 | Fiat Punto | 8% | 41 | |
| 108 | Citroen Berlingo | 8.2% | 55 | |
| 108 | Hyundai Santafe | 8.2% | 57 | |
| 110 | Alfa Romeo 159 | 8.5% | 58 | |
| 110 | Peugeot 1007 | 8,5% | 30 | |
| 110 | Seat Ibiza / Cordoba | 8,5% | 41 | |
| 113 | Peugeot 207 | 8,7% | 39 | |
| 114 | Renault Laguna | 8,8% | 64 | |
| 115 | Renault Kangoo | 8,9% | 47 | |
| 116 | Citroen C4 | 9% | 48 | |
| 117 | Kia Sorento | 9, 2% | 55 | |
| 118 | Volvo V70 / XC70 | 9,3% | 81 | |
| 119 | Peugeot 307 | 9,9% | 50 | |
| 120 | Citroen C5 | 10% | 61 | |
| 120 | Renault Espace | 10% | 67 | |
| 122 | Citroen C2 | 10,1% | 38 | |
| 123 | Dacia Logan | 11% | 48 | |
| 123 | Peugeot 407 | 11% | 63 | |
| 125 | Volvo XC90 | 11,2% | 73 | |
| 126 | Fiat Doblo | 11,8% | 56 | |
| 127 | Hyundai Atos | 12,2% | 31 | |
| 128 | Kia Carnival | 23.8% | 58 |
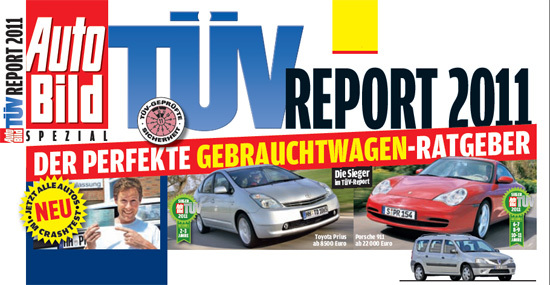
The authoritative automobile edition AUTO BILD has published the next reliability rating of the car - TUV 2011 Report. This time statistics on 7 253 709 cars of Germany are collected. As always, all cars were divided into 5 age groups: 2-3, 4-5, 6-7, 8-9, 10-11 years.
Rating is no longer relevant. Read this: reliability rating of the car 2012.

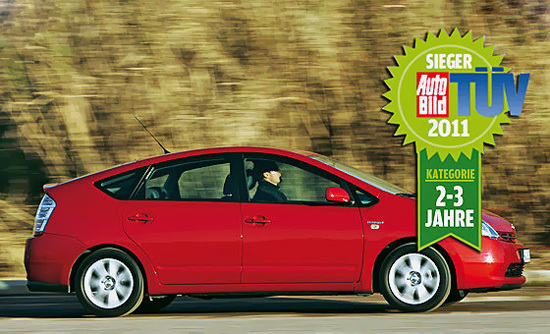
What is noticeable in this rating - in the group of 2-3 summer cars this time the first place in reliability went to the Toyota Prius. This I hybrid iron horse took the first place in the reliability rating of TUV.Further the layout is for the most part familiar - the second place was occupied by: Porsche 911, Toyota Auris and Mazda 2. Well, this closes the top three in terms of reliability, the newcomer of the TOP is Smart Fortwo. In other age groups, Porsche and Toyota cars are the leaders in reliability.

And in general, with regret, it is necessary to emphasize - there is a significant drop in the quality of the car already. In this rating, this is indicated by an increase in the number of faults by 1.9 percent compared to the data of the past year( TUV 2010) and now this figureis 19.5% of all tested vehicles( here is a graph of changes in the number of faults in the last 15 years according to TUV).
The Chairman of the VDTUV Executive Board, Dr. Klaus Bruggemann, commented: "We believe that the increase in the number of defects is a consequence of the economic and financial crisis."
And then we suggest you to familiarize yourself with the data of this auto rating.
Table of reliability rating TUV-2011 for cars of 2-3 years of age:
Based on materials: http://auto.ironhorse.ru


